Day 40

MATH 313: Survey Design and Sampling

Introduction to Survey Weights

  • Complex Sampling Designs often involve:
    • Stratification, Clustering, Unequal probabilities of selection
    • Multiple stages of selection, Systematic selection
  • Usual estimation and testing procedures may not be appropriate due to these features.

Importance of Weights

  • Unbiased Estimates: Weights correct for variable probabilities of selection.
  • Precision of Estimates: Adjust variance estimators to reflect complex sample designs.
  • Adjustments for Nonresponse: Increase weights for responding units to account for non-respondents.
  • Benchmarking: Adjust survey estimates to external census estimates.

Weighting in Practice vs Theory

  • Theoretical Background: Unbiased estimator of a population total: \[\frac{N}{n} \sum_{i=1}^{n} y_{i}\]
    • \(N\): Population size, \(n\): Sample size, \(y_i\): Sample observations
  • Practical Application: Focus is on constructing the actual weights to use in analysis.

Case Study: Housing Permits in Florida

  • Objective: Estimate total building permits in FL in 2000 from a sample.
  • Method: Sample 10 of Florida’s 67 counties, using area as a proxy for sampling probability.

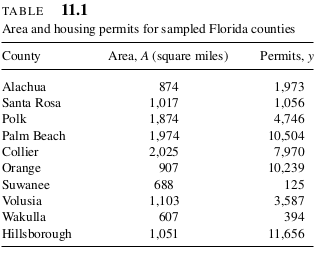
Data Example: Florida Counties

Analysis Using Survey Weights

  • Weights: Inverse of the probability proportional to area, \(w_i=1 / A_i\)
  • Weighted Estimate: \[\hat{\mu} = \frac{\sum w_{i} y_{i}}{\sum w_{i}}\]
  • Variance:
    • Standard errors calculated using ratio estimator techniques.

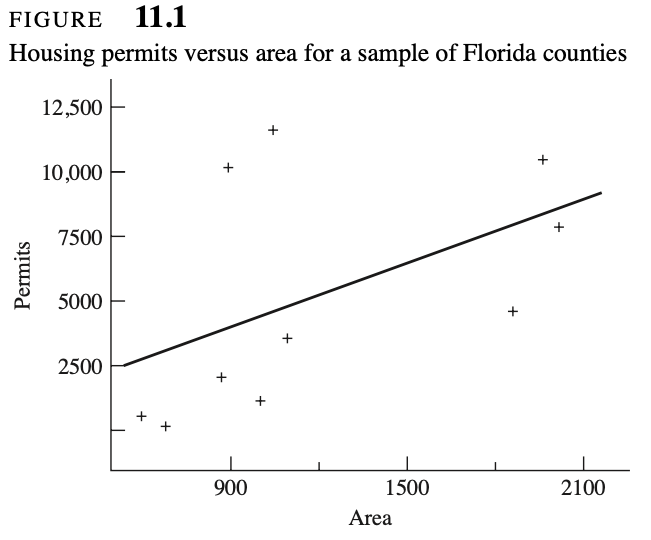
Example 11.6 Textbook: This study aims to estimate the total number of housing unit building permits issued in Florida in 2000 by analyzing a sample from ten of the state’s 67 counties. The counties were selected randomly, and data on the number of approved building permits and county area in square miles were recorded. These measures are sourced from census data. The total area for all counties is not known for this example, and the data will be used to calculate the estimate and its standard error.

Discussion: API Dataset (R)

  • Dataset: From the survey package, includes student achievement and demographic data.
  • Application: Demonstrate how weights can adjust for school size and demographic biases in educational data analysis.

Data summary
Name apistrat
Number of rows 200
Number of columns 39
_______________________
Column type frequency:
numeric 28
________________________
Group variables None

Variable type: numeric

skim_variable n_missing complete_rate mean sd p0 p25 p50 p75 p100 hist
snum 0 1.00 3077.27 1841.20 114.00 1495.25 3022.50 4688.00 6173.00 ▇▆▇▆▇
dnum 0 1.00 444.71 211.24 19.00 259.00 453.50 627.75 825.00 ▃▆▇▇▅
cnum 0 1.00 27.32 14.55 1.00 18.00 29.00 37.00 56.00 ▃▇▅▆▃
flag 200 0.00 NaN NA NA NA NA NA NA
pcttest 0 1.00 98.11 3.76 66.00 98.00 99.00 100.00 100.00 ▁▁▁▁▇
api00 0 1.00 652.82 120.97 398.00 555.25 658.50 743.25 893.00 ▃▆▇▆▃
api99 0 1.00 624.82 124.56 383.00 525.75 626.00 707.50 890.00 ▅▇▇▆▃
target 20 0.90 10.00 5.32 1.00 6.00 10.00 14.00 21.00 ▇▇▇▆▃
growth 0 1.00 28.00 28.12 -47.00 6.75 25.00 48.00 133.00 ▁▇▇▂▁
meals 0 1.00 44.99 28.97 0.00 20.75 39.50 69.00 100.00 ▇▇▆▆▅
ell 0 1.00 20.94 19.77 0.00 5.00 16.00 32.25 84.00 ▇▅▂▁▁
mobility 0 1.00 16.40 12.12 1.00 10.00 14.00 19.00 99.00 ▇▂▁▁▁
acs.k3 103 0.48 19.16 1.22 16.00 18.00 19.00 20.00 24.00 ▁▇▅▁▁
acs.46 66 0.67 28.86 3.42 20.00 27.00 29.00 31.00 46.00 ▂▇▃▁▁
acs.core 94 0.53 27.37 3.18 15.00 26.00 28.00 29.00 35.00 ▁▂▇▇▂
pct.resp 0 1.00 72.31 31.51 0.00 63.75 86.00 94.25 100.00 ▂▁▁▂▇
not.hsg 0 1.00 17.66 17.13 0.00 3.00 12.00 26.25 75.00 ▇▃▂▁▁
hsg 0 1.00 22.86 15.11 0.00 14.75 22.00 30.00 100.00 ▇▇▁▁▁
some.col 0 1.00 22.96 11.21 0.00 15.75 24.00 31.00 50.00 ▃▆▇▆▁
col.grad 0 1.00 21.38 14.25 0.00 10.00 21.00 31.00 100.00 ▇▇▁▁▁
grad.sch 0 1.00 9.72 11.71 0.00 2.00 6.00 12.00 55.00 ▇▂▁▁▁
avg.ed 0 1.00 2.81 0.69 1.38 2.29 2.82 3.31 4.44 ▃▆▇▅▂
full 0 1.00 86.60 13.57 24.00 81.00 91.00 97.00 100.00 ▁▁▁▃▇
emer 0 1.00 12.21 12.11 0.00 3.00 9.00 17.00 72.00 ▇▂▁▁▁
enroll 0 1.00 746.68 549.93 119.00 363.75 554.50 961.25 3156.00 ▇▂▁▁▁
api.stu 0 1.00 619.07 462.32 106.00 310.50 459.00 780.75 2900.00 ▇▂▁▁▁
pw 0 1.00 30.97 13.40 15.10 19.05 32.28 44.21 44.21 ▇▁▁▁▇
fpc 0 1.00 2653.75 1774.14 755.00 952.25 2719.50 4421.00 4421.00 ▇▁▁▁▇

Implementation in R

library(survey)
data(api)
# Create survey design without weights
strat_design <- svydesign(ids = ~1, data = apistrat)

# Create survey design with weights
weighted_design <- svydesign(ids = ~1, weights = ~pw, data = apistrat)

# Estimate mean without weights
mean_srs <- svymean(~api00, strat_design)
mean_srs
        mean    SE
api00 652.82 8.554
# Estimate mean with weights
mean_weighted <- svymean(~api00, weighted_design)
mean_weighted
        mean     SE
api00 662.29 9.5854

Summary: Key Concepts in Survey Weighting

  • Discussion: Weights adjust for sampling design and population structure, often providing a more representative estimate of the population mean.
  • Data Preparation:
    • Cleaning and Validation: Remove errors and standardize data formats.
    • Handling Outliers and Missing Data: Implement strategies to ensure quality data input.
  • Identifying Weighting Variables:
    • Key Factors: Age, gender, income, education, location.
    • Sources: Use census data and other reliable demographic sources.
  • Calculating Weighting Factors:
    • Stratification: Align sample distribution with population.
    • Raking: Iteratively adjust weights to match population characteristics.
    • Calibration: Adjust sample weights using known population totals.

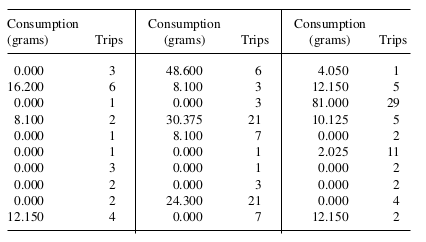
Example2 : Scientists studying fish consumption in a specified body of water periodically sent field workers out to interview everyone fishing in that water in those selected periods. Among other variables, the field-workers collected data on the amount of fish from that water the person consumed over the past month and the number of times the person fished in that water over the survey period (see the accompanying table). One goal of the study is to estimate the mean amount of fish consumed over the past month per person fishing in that body of water. Find and justify a reasonable estimate of this mean and provide a margin of error for the estimate.