Day 32
MATH 313: Survey Design and Sampling
Cluster Sampling Combined with Stratification
- Combining cluster sampling with stratified sampling optimizes representativeness by considering variations within and across strata.
- Stratification before clustering allows for a targeted approach in each stratum, improving the efficiency of the sampling design.
Example: Educational Research Study
Imagine an educational researcher wants to assess the impact of a new teaching method on student performance across different school types—public, private, and charter. Each type of school represents a stratum. The goal is to ensure that the sample reflects the diversity within each type of school.
Steps
- Stratification: Divide the schools into three strata based on their type (public, private, charter).
- Cluster Selection: Within each stratum, select entire classes randomly as clusters. This might mean selecting 3 classes from 5 schools in each stratum.
- Data Collection: Evaluate the teaching method’s impact by measuring performance in selected classes within each stratum.
Ratio Estimator Formula
\[ \bar{y}_{\mathrm{C}} = \frac{M_{1} \bar{\tau}_{\mathrm{t1}} + M_{2} \bar{\tau}_{\mathrm{t2}} + M_{3} \bar{\tau}_{\mathrm{t3}}}{M_{1} \bar{n}_{1} + M_{2} \bar{n}_{2} + M_{3} \bar{n}_{3}} \]
- This formula provides a weighted average of the cluster totals from each stratum, where \(M_1\), \(M_2\), and \(M_3\) represent the total number of students sampled in public, private, and charter schools, respectively.
- \(\bar{\tau}_{\mathrm{t1}}\), \(\bar{\tau}_{\mathrm{t2}}\), and \(\bar{\tau}_{\mathrm{t3}}\) are the average total performance scores from the sampled clusters in public, private, and charter schools.
- \(\bar{n}_{1}\), \(\bar{n}_{2}\), \(\bar{n}_{3}\) are the average class sizes in the sampled clusters of public, private, and charter schools.
Variance of the Ratio Estimator
\[ \hat{V}\left(\bar{y}_{\mathrm{C}}\right) = \frac{1}{N^{2}} \left(M_{1}^{2} \left(1-\frac{m_{1}}{M_{1}}\right) \frac{s_{\mathrm{c1}}^{2}}{n_{1}} + M_{2}^{2} \left(1-\frac{m_{2}}{M_{2}}\right) \frac{s_{\mathrm{c2}}^{2}}{n_{2}} + M_{3}^{2} \left(1-\frac{m_{3}}{M_{3}}\right) \frac{s_{\mathrm{c3}}^{2}}{n_{3}}\right) \] - This variance formula calculates the precision of the weighted average of cluster totals across public (\(M_{1}\)), private (\(M_{2}\)), and charter (\(M_{3}\)) schools.
- The first variance, \(s_{\mathrm{c} 1}^2\), is the variance of terms \(\left(\tau_i-\bar{y}_{\mathrm{c}} n_i\right)\) from stratum 1. The second variance, \(s_{\mathrm{c} 2}^2\), is the variance of terms \(\left(\tau_i-\bar{y}_{\mathrm{c}} n_i\right)\) from stratum 2 and so on.
Cluster Sampling with Probabilities Proportional to Size (PPS)
- PPS sampling is designed to give larger or more significant clusters a higher probability of selection, reflecting their greater impact on the population parameter being estimated.
- This method often results in a more accurate representation of the population because it reduces sampling variance compared to simple random sampling.
Example: Bird Population Study in National Parks
Consider a study aimed at estimating the population of a specific bird species across various national parks. Each park represents a potential cluster with varying areas and bird densities.
Steps
- Identify Clusters: Each national park is a cluster.
- Measure Size: Estimate the area of each park and the density of bird sightings from preliminary surveys.
- Assign Probabilities: Larger parks with higher bird densities have a higher probability of being sampled, proportional to their estimated bird population.
Data Collection
- Select parks based on their assigned probabilities, ensuring that parks contributing more significantly to the bird population are more likely to be included.
- Conduct detailed bird counts in the selected parks to estimate the overall population.
PPS Estimator Formula
\[ \hat{\tau}_{\mathrm{pps}} = \frac{N}{m} \sum_{i=1}^{m} \frac{\tau_{i}}{n_i} \] - Here, \(N\) is total elements in the population, providing a scale factor for the total estimated from the sample.
Variance of PPS Estimator
\[ \hat{V}\left(\hat{\tau}_{\mathrm{pps}}\right) = \frac{N^{2}}{m(m-1)} \sum_{i=1}^{m} \left(\bar{\tau}_{i} - \hat{\mu}_{\mathrm{pps}}\right)^{2} \]
- The variance formula accounts for the probability proportionate size of clusters, enhancing the precision of the estimate.
Estimating Population Mean
\[ \hat{\mu}_{\mathrm{pps}} = \frac{1}{N} \hat{\tau}_{\mathrm{pps}} = \frac{1}{m} \sum_{i=1}^{m} \bar{\tau}_{i} \] - This estimator calculates the average per element in the population, scaling the total by the inverse of the average cluster size.
Variance of mean
\[\hat{V}\left(\hat{\mu}_{\mathrm{pps}}\right)=\frac{1}{m(m-1)} \sum_{i=1}^m\left(\bar{\tau}_i-\hat{\mu}_{\mathrm{pps}}\right)^2\]
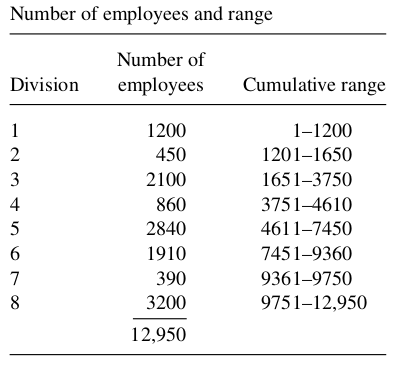
Example 1 (Example 8.12 Textbook) An auditor wishes to sample sick-leave records of a large firm in order to estimate the average number of days of sick leave per employee over the past quarter. The firm has eight divisions, with varying numbers of employees per division. Because number of days of sick leave used within each division should be highly correlated with the number of employees, the auditor decides to sample \(n=3\) divisions with probabilities proportional to number of employees. Show how to select the sample if the numbers of employees in the eight divisions are \(1200,450,2100,860,2840,1910,390, and 3200\). Suppose the total number of sick-leave days used by the three sampled divisions during the past quarter are, respectively, \[ \tau_1=4320 \quad \tau_2=4160 \quad \tau_3=5790 \]

Estimate the average number of sick-leave days used per person for the entire firm and place a bound on the error of estimation.