Day 29
MATH 313: Survey Design and Sampling
Estimating the Population Total with Cluster Sampling
Cluster sampling is not only effective for estimating mean values but also invaluable for calculating the total of a population characteristic, such as total income, total population, or total number of cases in epidemiological studies. This method is especially useful when complete enumeration isn’t feasible or when the population size is uncertain.
Why Estimate Population Totals?
Estimating population totals is crucial for:
- Allocating resources appropriately based on total needs.
- Planning and policy-making in governmental and non-governmental sectors.
- Evaluating total market sizes or total disease burden in public health initiatives.
Estimator of the Population Total \(\tau\) When \(N\) is Known
When the total number of elements in the population, \(N\), is known, the population total \(\tau\) can be directly estimated using the sampled data:
Estimator Formula
\[ \tau = N \cdot \bar{y} \] Here, \(\bar{y}\) is the estimated mean from the cluster sample, calculated as \(\bar{y} = \frac{\sum_{i=1}^{m} \tau_i}{\sum_{i=1}^{m} n_i}\), where \(m\) is the number of sampled clusters, and \(\tau_i\) is the total income for the \(i\)th cluster.
Variance Estimation When \(N\) is Known
With a known \(N\), the variance of the estimator \(\tau\) is derived directly from the variance of \(\bar{y}\):
Variance Formula
\[ \hat{V}(\tau) = N^2 \cdot \hat{V}(\bar{y}) \]
Estimator of the Population Total \(\tau\) When \(N\) is Unknown
Often, the exact number of elements in the population (\(N\)) is unknown, which is a common scenario in cluster sampling where only a portion of clusters are surveyed. Thus, a direct estimation using \(N \cdot \bar{y}\) isn’t feasible.
Alternative Estimator \(\bar{\tau}\)
Instead, we use the estimator \(\bar{\tau}\) given by:
\[ \bar{\tau}=\frac{1}{m} \sum_{i=1}^{m} \tau_{i} \] This represents the average of the cluster totals for the \(m\) sampled clusters and is an unbiased estimator of the average of the \(M\) cluster totals in the population. Therefore, to estimate the total population \(\tau\), we can use:
\[ M \bar{\tau}=\frac{M}{m} \sum_{i=1}^{m} \tau_{i} \]
where \(M\) can be estimated by extrapolating the sample results to the entire population. If \(M\) is completely unknown, proxy measures or statistical models must be used to approximate it.
Variance Estimation When \(N\) is Unknown
The variance of \(N \bar{\tau}\), when \(N\) is unknown and approximated, is calculated as follows: \[ \hat{V}(M \bar{\tau}) = M^2 \hat{V}(\bar{\tau}) \] where: \[ \hat{V}(\bar{\tau}) = \left(1 - \frac{m}{M}\right) \frac{s_{\mathrm{t}}^2}{m} \] and \(s_{\mathrm{t}}^2\) is computed by: \[ s_{\mathrm{t}}^2 = \frac{\sum_{i=1}^{m}(\tau_{i} - \bar{\tau}_{\mathrm{t}})^2}{m-1} \] This variance helps in constructing confidence intervals that provide insights into the reliability of the estimated total \(\tau\).
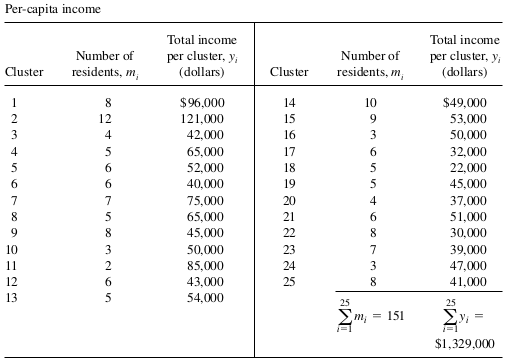
Example 1: (Same as Day 28) A sociologist wants to estimate the per-capita income in a certain small city. No list of resi- dent adults is available. So she performed cluster sampling. The city is marked off into rectangular blocks, except for two industrial areas and three parks that contain only a few houses. The sociologist decides that each of the city blocks will be considered one cluster, the two industrial areas will be considered one cluster, and finally, the three parks will be considered one cluster. The clusters are numbered on a city map, with the numbers from 1 to 415.The experimenter has enough time and money to sample clusters and to interview every household within each cluster. Hence, 25 random numbers between 1 and 415 are selected, and the clusters having these numbers are marked on the map.Interviewers are then assigned to each of the sampled clusters. The data on incomes are presented in the following.

Use the data in Example 1, estimate the total income of all residents of the city, if (a), the population size is not known; (b), if there are 2500 residents in the city.