Day 26
MATH 313: Survey Design and Sampling
Estimation of Population Mean
The population mean \(\mu\) can be estimated from a systematic sample using the sample mean \(\bar{y}_{\text{sy}}\):
\[ \hat{\mu} = \bar{y}_{\text{sy}} = \frac{\sum_{i=1}^{n} y_i}{n} \]
Variance Estimation: \[ \hat{V}(\bar{y}_{\text{sy}}) = \left(1-\frac{n}{N}\right) \frac{s^2}{n} \]
This assumes the population is randomly ordered. The estimated variance matches that of simple random sampling under similar conditions.
Variance Considerations in Systematic Sampling
Systematic sampling can exhibit different variance properties based on the population structure:
- Random Population: \(\rho \approx 0\), variance is similar to simple random sampling.
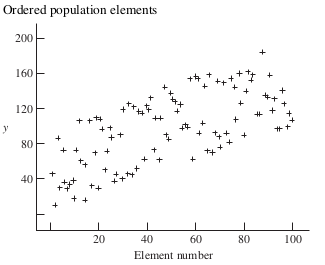
- Ordered Population: \(\rho < 0\), potentially lower variance than simple random sampling.
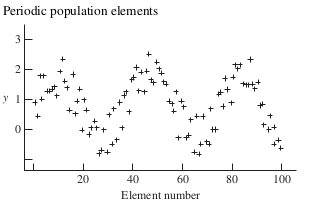
- Periodic Population: \(\rho > 0\), possibly higher variance due to repetitive patterns.
Variance Formula: \[ V(\bar{y}_{\text{sy}}) = \frac{\sigma^2}{n} [1 + (n-1) \rho] \]
Here, \(\rho\) is a measure of the correlation between pairs of elements within the same systematic sample. The correlation \(\rho\) affects variance estimation significantly depending on the population’s arrangement.
Population Types
- Random Population: Elements are in random order. Only suitable for certain variance formulas.
\[ \hat{V}\left(\bar{Y}_{\text{sy}}\right) \text{ is applicable only to random order populations.} \]
Ordered Population: Elements show a trend (upward or downward).
Periodic Population: Elements exhibit regular upward and downward cycles.

|

|

|
Systematic Sampling and Population Types
- Random Population: Systematic sampling approximates simple random sampling.
\[ \rho \approx 0 \quad \text{Systematic} \approx \text{Simple Random} \]
Ordered Population: Large differences between elements. Systematic sampling preferred if \(\rho < 0\).
Periodic Population: Small differences between elements. Systematic sampling less effective if \(\rho > 0\) (close to 1).
Estimating Population Total
Systematic Sampling Estimator for Population Total \(\tau\):
\[ \hat{\tau}_{sy} = N \cdot \bar{y}_{sy} \]
Estimated Variance of \(\hat{\tau}_{sy}\):
\[ \hat{V}\left(\hat{\tau}_{sy}\right) = N^{2} \left(1 - \frac{n}{N}\right) \frac{s^{2}}{n} \]
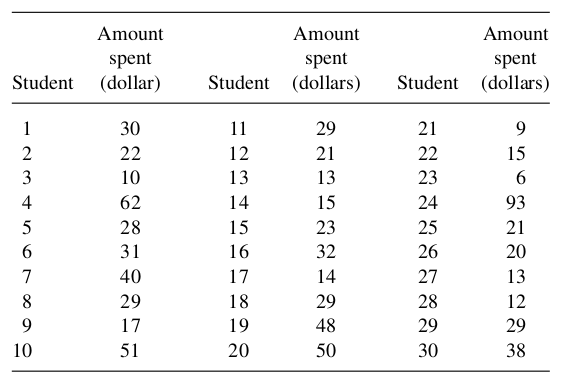
Example 1: (Ex 7.11, textbook) A college is concerned about improving its relations with a neighboring community. A 1-in-150 systematic sample of the \(N=4500\) students listed in the directory is taken to estimate the total amount of money spent on clothing during one quarter of the school year. The results of the sample are listed in the accompanying table. Use these data to estimate \(\tau\) and place a bound on the error of estimation.

(Ex 7.12, textbook) What sample size is needed to estimate \(\tau\) in Example 1 with a bound on the error of estimation approximately equal to \(\$ 10,000\) ? What systematic sampling scheme do you recommend?
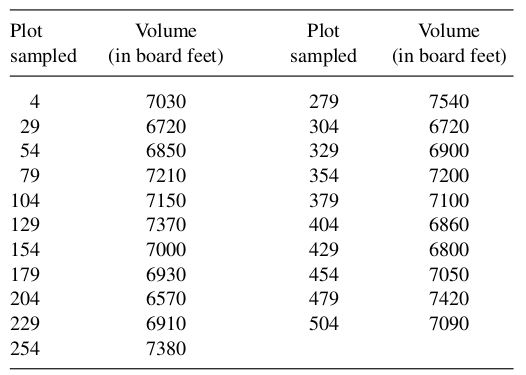
Example 2: Foresters are interested in determining the mean timber volume per acre for 520 one-acre plots \((N=520)\). A 1 -in- 25 systematic sample is conducted. Using the data presented in the accompanying table, estimate \(\mu\), the average timber volume per plot, and place a bound on the error of estimation.
