| Number_of_Children | Probability |
|---|---|
| 0 | 0.273 |
| 1 | 0.160 |
| 2 | 0.244 |
| 3 | 0.154 |
| 4 | 0.082 |
| 5 | 0.039 |
| 6 | 0.020 |
| 7 | 0.011 |
| 8 | 0.017 |
Day 2
MATH 313: Survey Design and Sampling
Bastola
Statistical Practice
- Accessing Population Data: Often, it’s impractical or impossible to examine every individual in a population.
- Why Sample?: We select a sample of size \(n\) because it allows us to estimate population characteristics like mean \(\mu\) and standard deviation \(\sigma\).
- Purpose of Sampling: Sampling helps infer the broader population’s characteristics from a representative set of data.
Population and Sample
- An element is an object on which a measurement is taken.
- A population is a collection of elements about which we wish to make an inference.
- A sample unit are non overlapping collections of elements from the population that cover the entire population.
- A frame is a list of sampling units.
- A sample is a collection of sampling units drawn from a single frame or from multiple frames.
Key Concept: Statistic
- Statistic help us summarize information about groups.
- Example: In a poll of 500 likely voters:
- 68% indicated that the economy is their top concern.
- This 68% is a statistic—it describes the sample of voters.
Definition: Parameter
- A parameter is a number that describes a population.
- Consider this scenario: After an election, 53% of voters supported a new park funding proposition.
- This 53% is a parameter—it describes the entire voting population’s preference.
Key Sample Statistics
- Sample Mean (\(\bar{y}\)):
- Calculation: \(\bar{y} = \frac{1}{n} \sum_{i=1}^n y_i\)
- Sample Variance (\(S^2\)):
- Calculation: \(S^2 = \frac{1}{n-1} \sum_{i=1}^n (y_i - \bar{y})^2\)
- Sample Standard Deviation (\(S\)):
- Calculation: \(S = \sqrt{S^2}\)
Understanding Random Variables (R.V.)
- Random Sampling: The process of randomly selecting an element from a population to survey its characteristics.
- Definition (Random Variables): A random variable is a numerical outcome of a probability experiment.
Random variables help us quantify the results of random sampling in numeric terms.
Probability Distribution of a R.V.
- Access to Population Data: If every element of the population is accessible, we can describe the chances of obtaining specific values of a random variable.
- Definition (Probability Distribution): For a discrete random variable, the probability distribution specifies the probability for each possible value of the random variable.
The probability distribution is fundamental in understanding how values of a random variable are distributed across possible outcomes.
Probability Distribution: Number of Children
\(Y=\{\text{Number of children per woman}\}\)
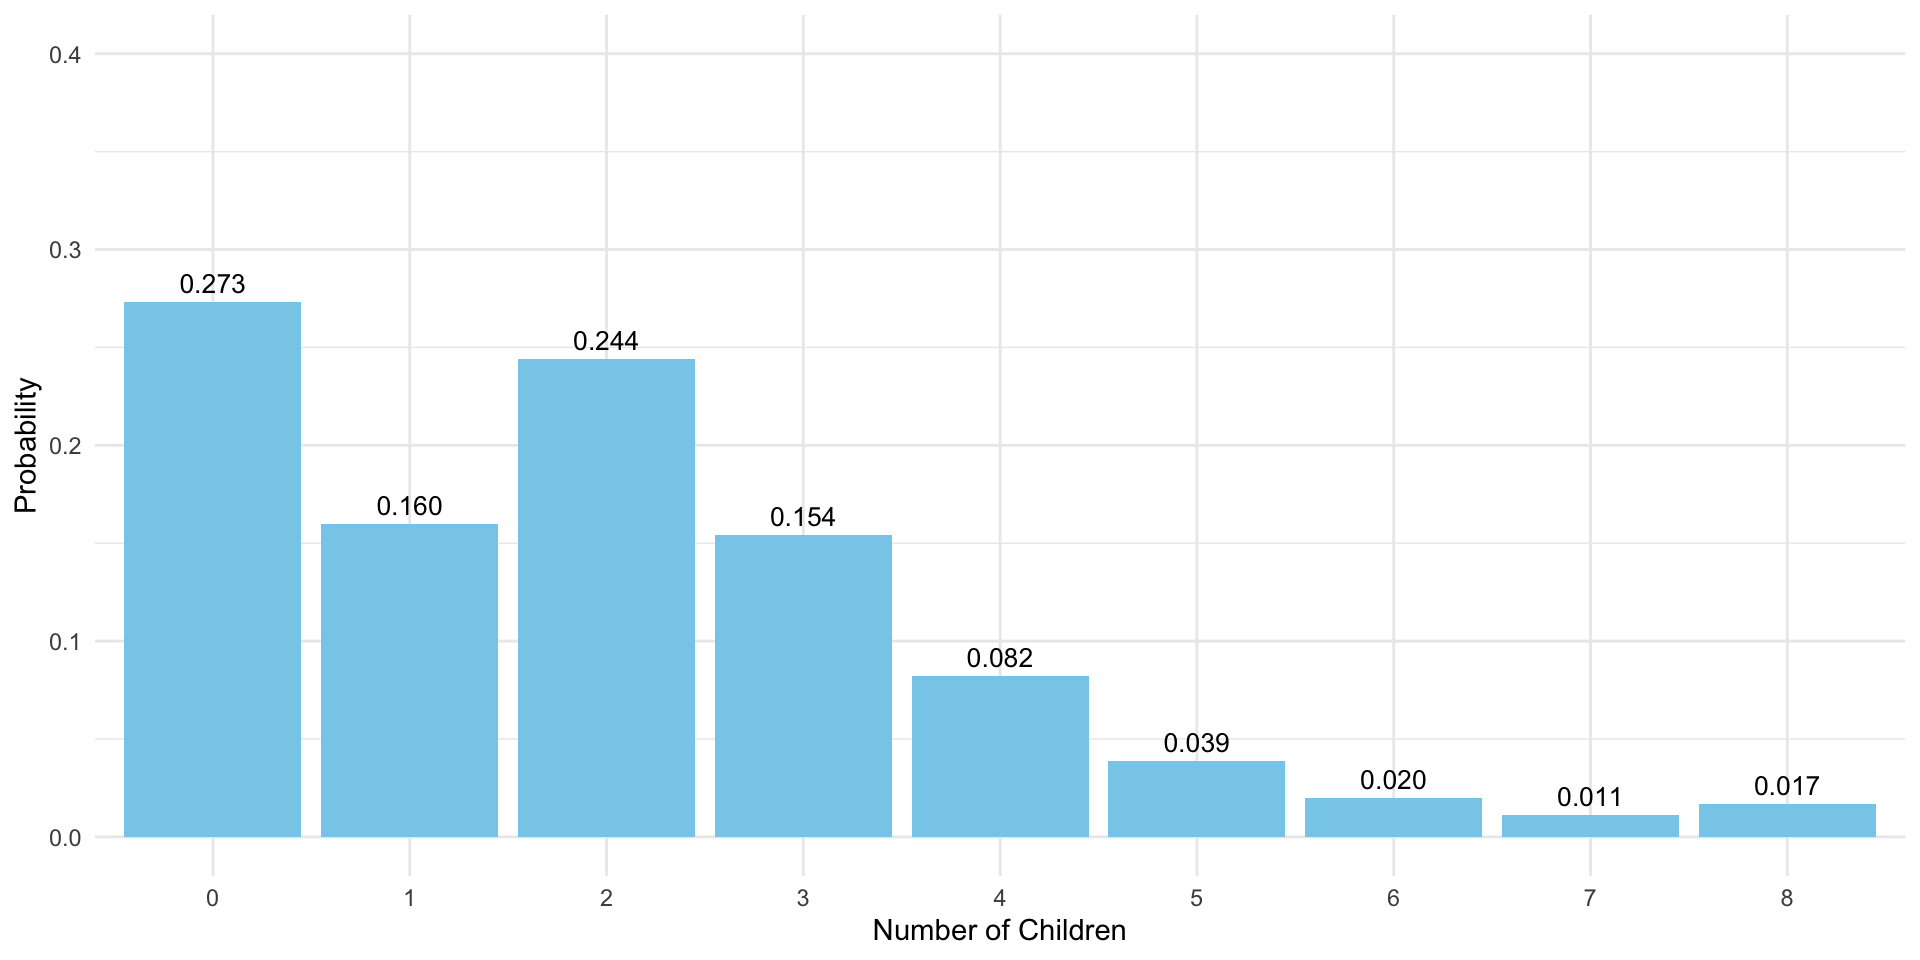
Probability Distribution Table
Probability Rules for \(P(y)\)
- Rule 1: Probability values are restricted between 0 and 1.
- Notation: \(0 \leqslant P(y) \leqslant 1\)
- Rule 2: The sum of the probabilities for all possible outcomes equals 1.
- Notation: \(\sum_y P(y) = 1\)
Quiz
- What is the probability that a randomly selected woman has exactly two children?
- What is the probability that a randomly selected woman has fewer two children?
Population Expected Value
The expected value summarizes the center of a distribution.
- Expected Value:
- Notation: \(E(y)=\sum_y y \cdot p(y)\)
- \(E(y)\) represents the average or mean value of all measurements in the population.
- Population Mean (\(\mu\)): Denoted by \(\mu\), it is equivalent to \(E(y)\) and is a parameter describing the population.
Variability Measures: Variance and Standard Deviation
- Variance: Measures the spread of measurements around the mean (\(\mu\)).
- Formula: \(\sigma^2=V(y)=E\left[(y-\mu)^2\right]=\sum_y(y-\mu)^2 \cdot p(y)\)
- Standard Deviation (SD): The square root of the variance, reflecting the average deviation from the mean.
- Formula: \(\sigma =SD=\sqrt{\sigma^2}\)
Calculate Sample Statistics
- Question: A simple random sample of size 10 from a population includes the following measurements:
- \(2, 0, 1, 0, 3, 2, 2, 6, 0, 1\)
- Task: Calculate the sample mean, variance, and standard deviation.
Chebyshev’s Inequality Explained
- Key Concept: Chebyshev’s Inequality states that for any dataset, the proportion of data within \(k\) standard deviations from the mean is at least \(1 - \frac{1}{k^2}\) for any \(k > 1\).
- Implication: As \(k\) increases, a larger proportion of the data is expected to fall closer to the mean, providing insight into data spread and central tendency.
Exercise
- Task: Calculate the minimum proportion of data within \(k\) standard deviations of the mean for \(k=2\) and \(k=3\).
- For \(k=2\): \[ \text{Proportion} = 1 - \frac{1}{k^2} = \ldots \]
- For \(k=3\): \[ \text{Proportion} = 1 - \frac{1}{k^2} = \ldots \]
Understanding Chebyshev’s Inequality
- Chebyshev’s Inequality Formula: \[
P(|y-\mu| \leq k \cdot \sigma) \geqslant 1-\frac{1}{k^2}
\]
- Interpretation: This formula states that the probability of the random variable \(y\) falling within \(k\) standard deviations (\(\sigma\)) of the mean (\(\mu\)) is at least \(1 - \frac{1}{k^2}\).