Day 17
MATH 313: Survey Design and Sampling
What we learned and what’s next?
- Review of previous sampling methods: Simple Random and Stratified Sampling
- Introduction to new methods based on relationships between variables:
- Ratio
- Regression
- Difference
- Today: Focus on Ratio Estimation using a practical example
Why Use Ratio Estimation?
- Efficiency: Improves the estimation of population totals using subsidiary information
- Cost-effective: Reduces the need for exhaustive data collection
- Applications: Useful in many fields such as agriculture, economics, and market research
Case Study: Estimating Sugar Content in Oranges
- Objective: Estimate total sugar content of an orange shipment
- Challenge: Direct measurement is time-consuming and costly
Relationship Between Variables
- Observed Relationship: Sugar content (\(y\)) is closely related to the weight (\(x\)) of oranges
- Utilization:
- Use weight as a subsidiary variable to estimate sugar content
- Avoids the need to count total number of oranges (\(N\))
Mathematical Basis of Ratio Estimation
\[ \begin{align*} \text{Given:} & \quad \frac{\mu_y}{\mu_x} = \frac{N \mu_y}{N \mu_x} = \frac{\tau_y}{\tau_x} \\ \text{Implication:} & \quad \tau_y = \frac{\mu_y}{\mu_x} \cdot \tau_x \\ \end{align*} \]
- \(\mu_y\) and \(\mu_x\): Mean sugar content and mean weight per orange, respectively
- \(\tau_y\) and \(\tau_x\): Total sugar content and total weight, respectively
Estimation Procedure
- Sample \(n\) oranges and measure:
- Sugar content \(y_1, y_2, \ldots, y_n\)
- Weight \(x_1, x_2, \ldots, x_n\)
- Calculate Sample Means:
- \(\bar{y}\) for sugar content
- \(\bar{x}\) for weight
\[ \text{Ratio Estimator:} \quad \hat{R} = \frac{\bar{y}}{\bar{x}} \]
Advantages of Ratio Estimation
- Precision: More precise estimates when \(x\) and \(y\) are correlated
- Flexibility: Can be adapted to various types of data and study designs
- Scalability: Effective for large datasets
Conclusion
- Ratio estimation leverages relationships between variables to enhance statistical efficiency and reduce costs.
- Essential tool for researchers dealing with correlated variables in large populations.
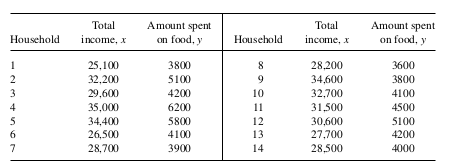
Example 1: A consumer survey was conducted to determine the ratio of the money spent on food to the total income per year for households in a small community. A simple random sample of 14 households was selected from 150 in the community. Sample data are given in the accompanying table. How to estimate the population ratio, \(R\) ?

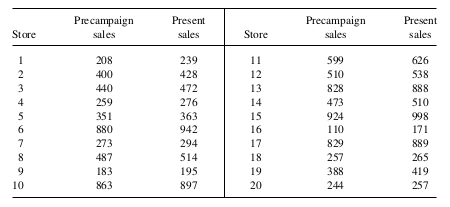
Example 2: An advertising firm is concerned about the effect of a new regional promotional campaign on the total dollar sales for a particular product. A simple random sample of \(n=20\) stores is drawn from the regional stores in which the product is sold. Quarterly sales data are obtained for the current three-month period and the three-month period prior to the new campaign. How to estimate the change?
