Day 16
MATH 313: Survey Design and Sampling
Issues in Stratified Sampling: Budget Constraints
Understanding the complexities and challenges of stratified random sampling is crucial for enhancing survey accuracy and efficiency. By addressing common issues such as budget constraints and optimal strata selection:
- We recognize that not all sampling can afford ideal sample sizes due to budget limits.
- Optimal allocation under fixed budgets aims to minimize variance, enhancing survey design to maximize resource use.
- This approach not only improves decision-making based on the data collected but also contributes to developing sophisticated statistical analysis techniques that are robust against real-world challenges.
Allocation Formula
Use the proportional allocation formula to determine sample sizes: \[n_i = \frac{C}{\sum_{i=1}^k c_i w_i} w_i\] Where:
- \(n_i\) = sample size for stratum \(i\)
- \(C\) = total budget
- \(c_i\) = cost per unit sampled in stratum \(i\)
- \(w_i\) = weight (proportion) of stratum \(i\) in the population
Optimal Rule for Choosing Strata
Goal: Minimize variance of the estimator. Strata should be homogeneous internally and heterogeneous externally.
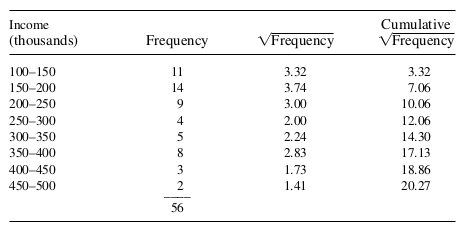
Cumulative Square Root of Frequency Method
Useful for delineating strata based on available frequency data. Summarize and stratify based on the cumulative square root of category frequencies. Generally, limit to five or six strata to avoid over-complication.
Practical Example
Stratify a population by income to estimate average household income:
- Group low-income households in one stratum.
- Group high-income households in another stratum.
This method is theoretical as it requires prior knowledge of incomes.
Example 1: In the television viewing example \(\left(N_1=155, N_2=62\right.\), and \(\left.N_3=93\right)\), the cost of obtaining an observation is \(c_1=c_2=\$ 9, c_3=\$ 16\). Let the stratum standard deviations be approximated by \(\sigma_1 \approx 5, \sigma_2 \approx 15, \sigma_3 \approx 10\). Given that the advertising firm has only \(\$ 500\) to spend on sampling, choose the sample size and the allocation that minimize \(V\left(\bar{y}_{s t}\right)\).
Example 2: In the television viewing example \(\left(N_1=155, N_2=62\right.\), and \(\left.N_3=93\right)\), the cost of obtaining an observation is \(c_1=c_2=\$ 9, c_3=\$ 16\). Let the stratum standard deviations-be approximated by \(p_1 \approx 0.80, p_2 \approx 0.25, p_3 \approx 0.50\) using some similar survey performed two years ago. Given that the advertising firm has only \(\$ 500\) to spend on sampling, choose the sample size and the allocation that \(minimize V\left(\hat{p}_{s t}\right)\).
Example 3: An investigator wishes to estimate the average yearly sales for 56 firms, using a sample of \(n=15\) firms. Frequency data on these firms is available in the form of classification by \(\$ 50,000\) increments and appears in the accompanying table. How can we best allocate the firms to \(L=3\) strata?![]()
